

Drag Racer Dragonfly
Seventh Grade Poster Problem:Ratios and Proportional Reasoning
This lesson gives students the opportunity to work with situations that represent three types of rate problems:
Downloadable Materials
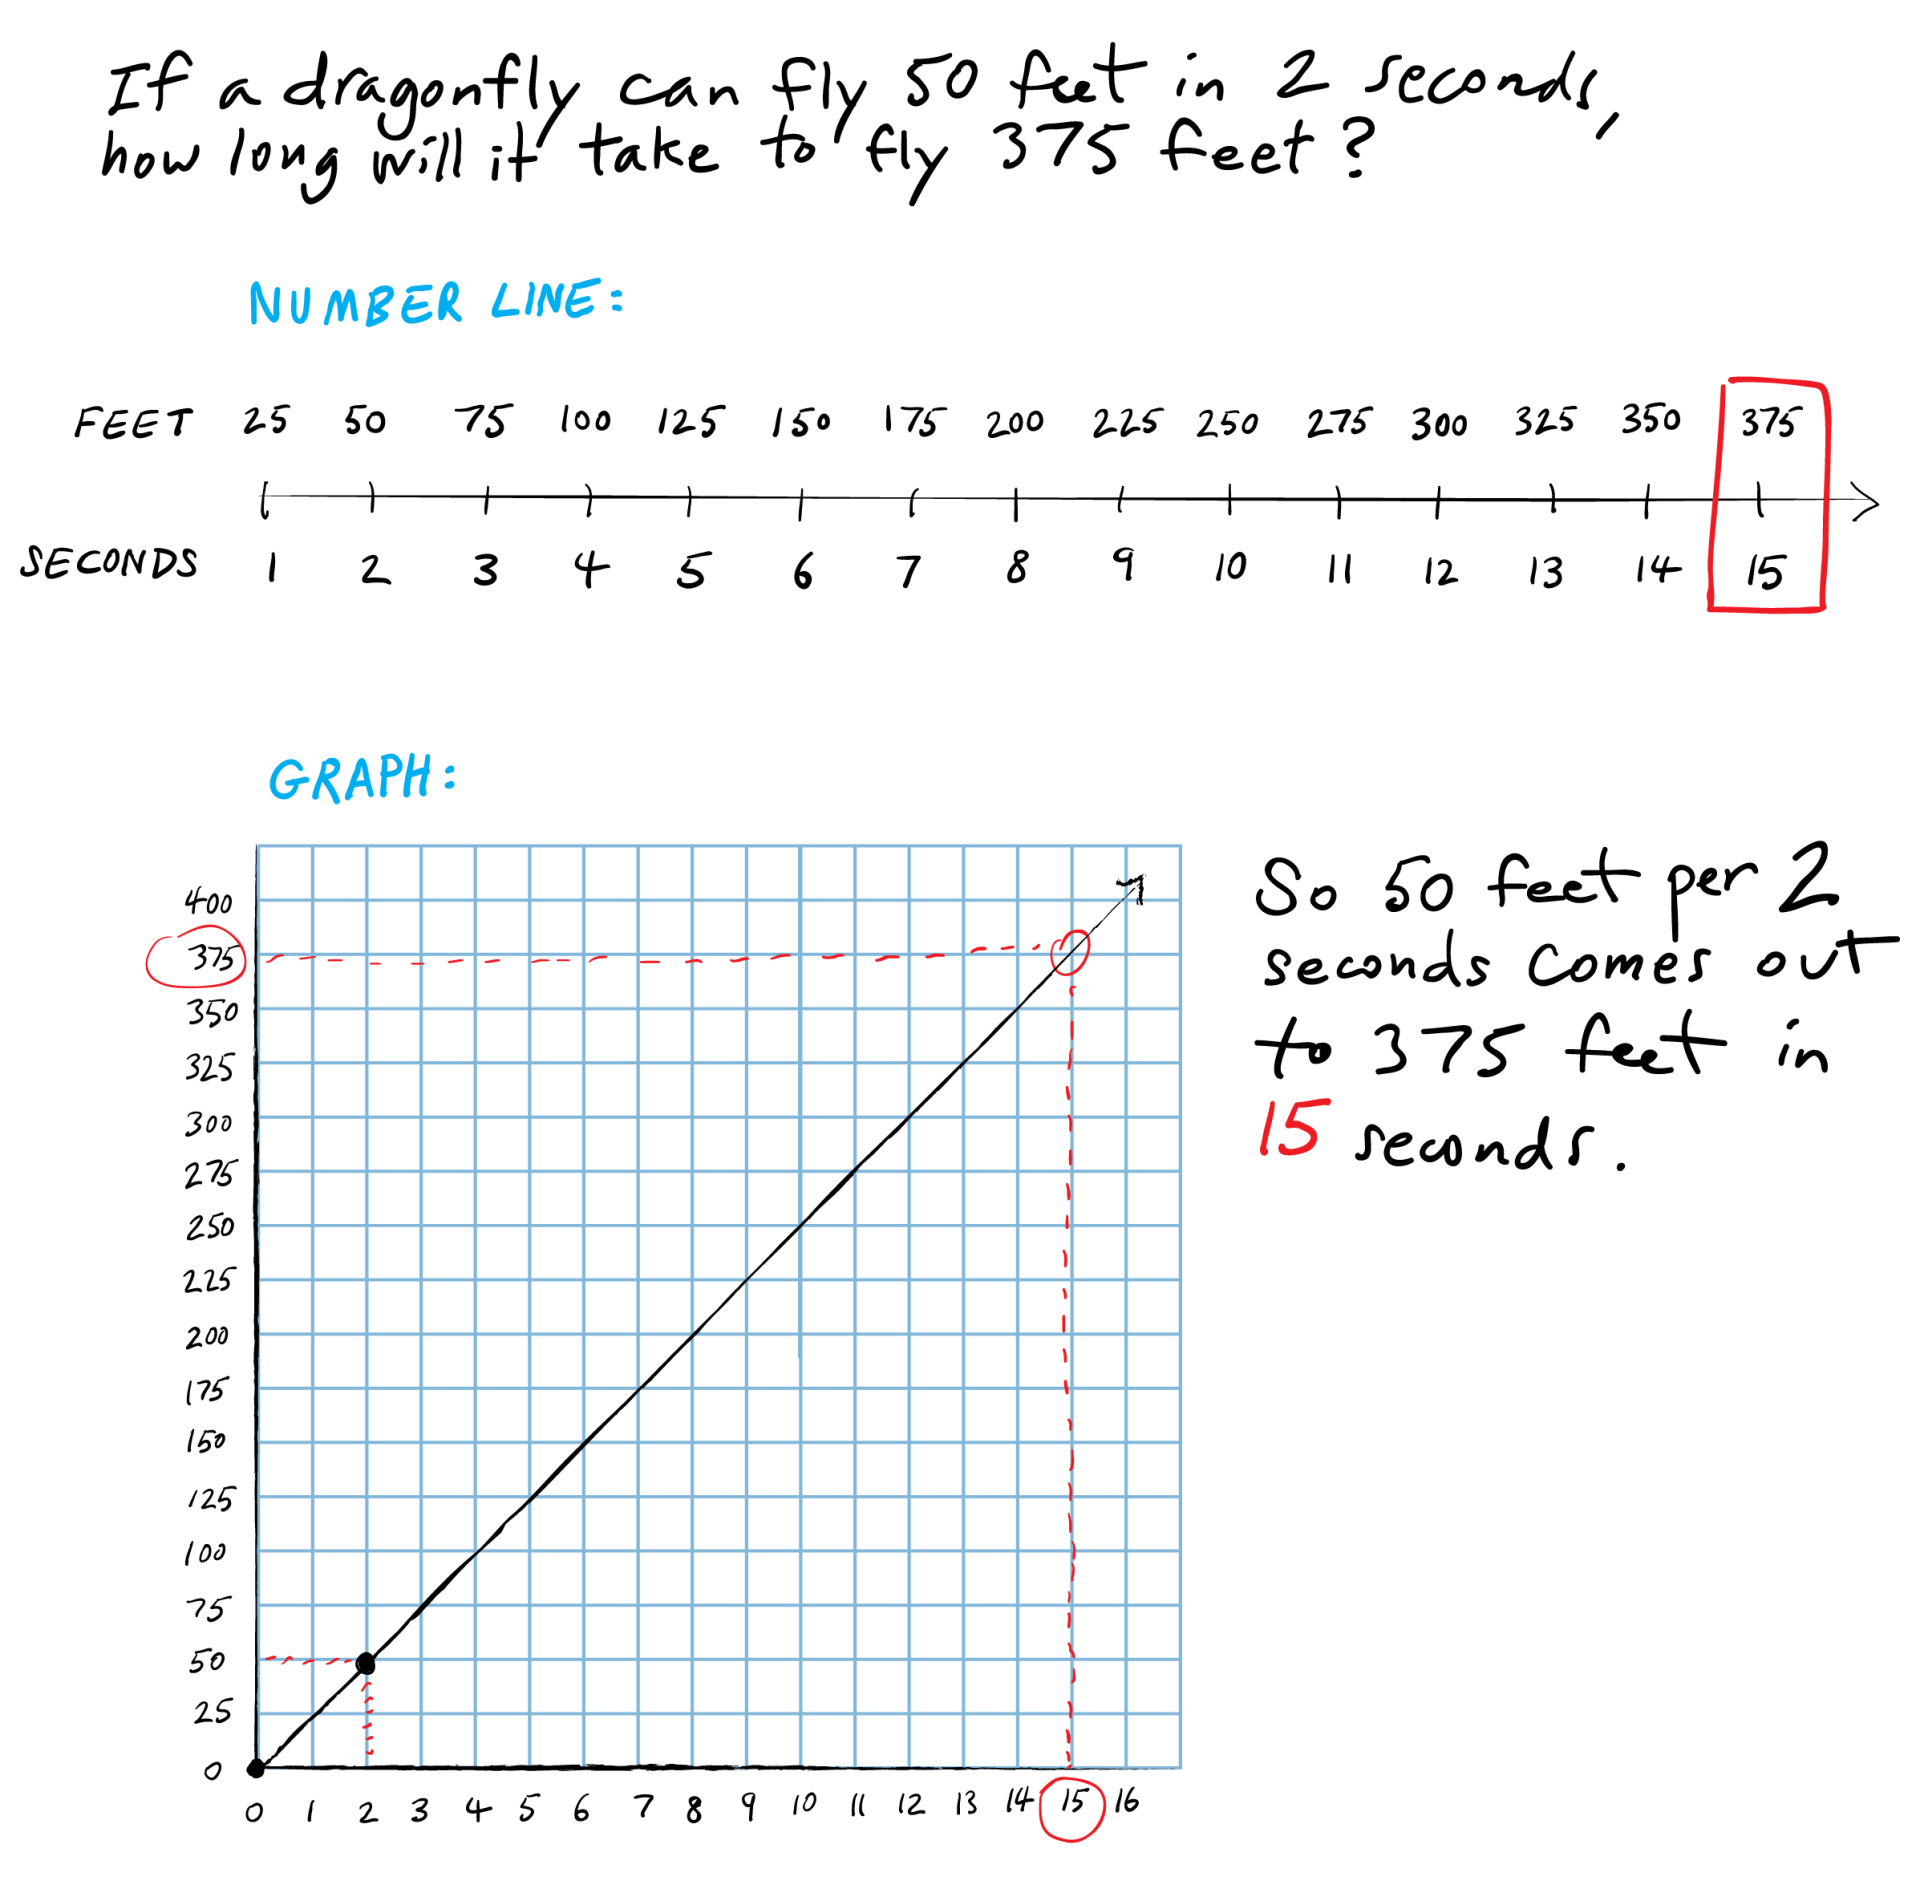
- How much time? In this situation, students need to determine how long it takes the dragonfly to fly a specific distance.
- How far? Here, students need to find the distance the dragonfly flew in a given time.
- How fast? In this case, students need to figure out the rate at which the dragonfly is flying.
Learning Objectives:
- Determine whether two quantities are in a proportional relationship.
- Solve problems by determining missing values in a proportional relationship.
- Identify the constant of proportionality (unit rate) in tables, graphs, equations, diagrams, and verbal descriptions of proportional relationships.
Common Core State Standards for Mathematics:
- 7.RP - 1, 2a, 2b, 2c, 2d
1. LAUNCH
Ask students if they have ever seen a dragonfly. Ask them to describe one to their classmates.
Show Slide #1
for a close-up look at a dragonfly.
Play Slide #2
to view a video of a dragonfly flying quickly across a lake.
Encourage a bit more discussion.
Then, Show Slide #3.
Read the information to the students. Ask: “Can you run as fast as a dragonfly can fly?”, “Can a car drive that fast?”
Ask students to visualize the information given on Slide #3. Have them picture a dragonfly flying the 50-foot distance in two seconds. You may want to illustrate 50 feet using steps or a yard ruler and two seconds with claps.
Explain to students that the world’s fastest sprinters run at about 35 feet per second. Ask them if this speed is faster or slower than a dragonfly.
(Note: The world's fastest sprinter is faster than a dragonfly; however, students can’t run that fast!)
2. POSE A PROBLEM
Show and read Slide #3
again.
A common green dragonfly, the fastest insect in the world, can fly a distance of 50 feet in 2 seconds.
Say: With this information we can determine other times and distances, and we can learn the rate at which the dragonfly flies.
Distribute Handout #1.
Handout #1 Answer Key
Say: This handout asks you to complete the table showing the time, distance, and the rate at which a dragonfly flies. You will also draw a graph to illustrate the rate at which a dragonfly flies.
3. WORKSHOP
Composing Original Dragonfly Word Problems
Begin by separating students into groups.
Show Slide #4. It asks students to make up and solve two original dragonfly word problems.
Say to students:
With your group, decide how fast your dragonfly flies. Use the same rate in both problems your group creates.
- One problem must give the time and the have you calculate the distance.
- The other problem must give the distance and have you calculate the time.
- Finally, prepare a poster that shows your solutions and how you think about the questions.
Encourage students to work together. Give students time to think about different ways to present their dragonfly questions.
You'll want to avoid showing students how to solve the problems. The purpose of this activity is to demonstrate the variety of approaches students use as they work toward a solution.
As you interact with groups, encourage a variety of approaches. Try to help students avoid simply accepting one strategy and disregarding another.
4. POST, SHARE, COMMENT
Sample Posters
5. STRATEGIC TEACHER-LED DISCUSSION
Most student responses will cluster around the following ways of thinking, which are listed in order of increasing mathematical sophistication. You will want to help students make connections among the various approaches used on the posters and and help everyone understand the usefulness of the higher levels.
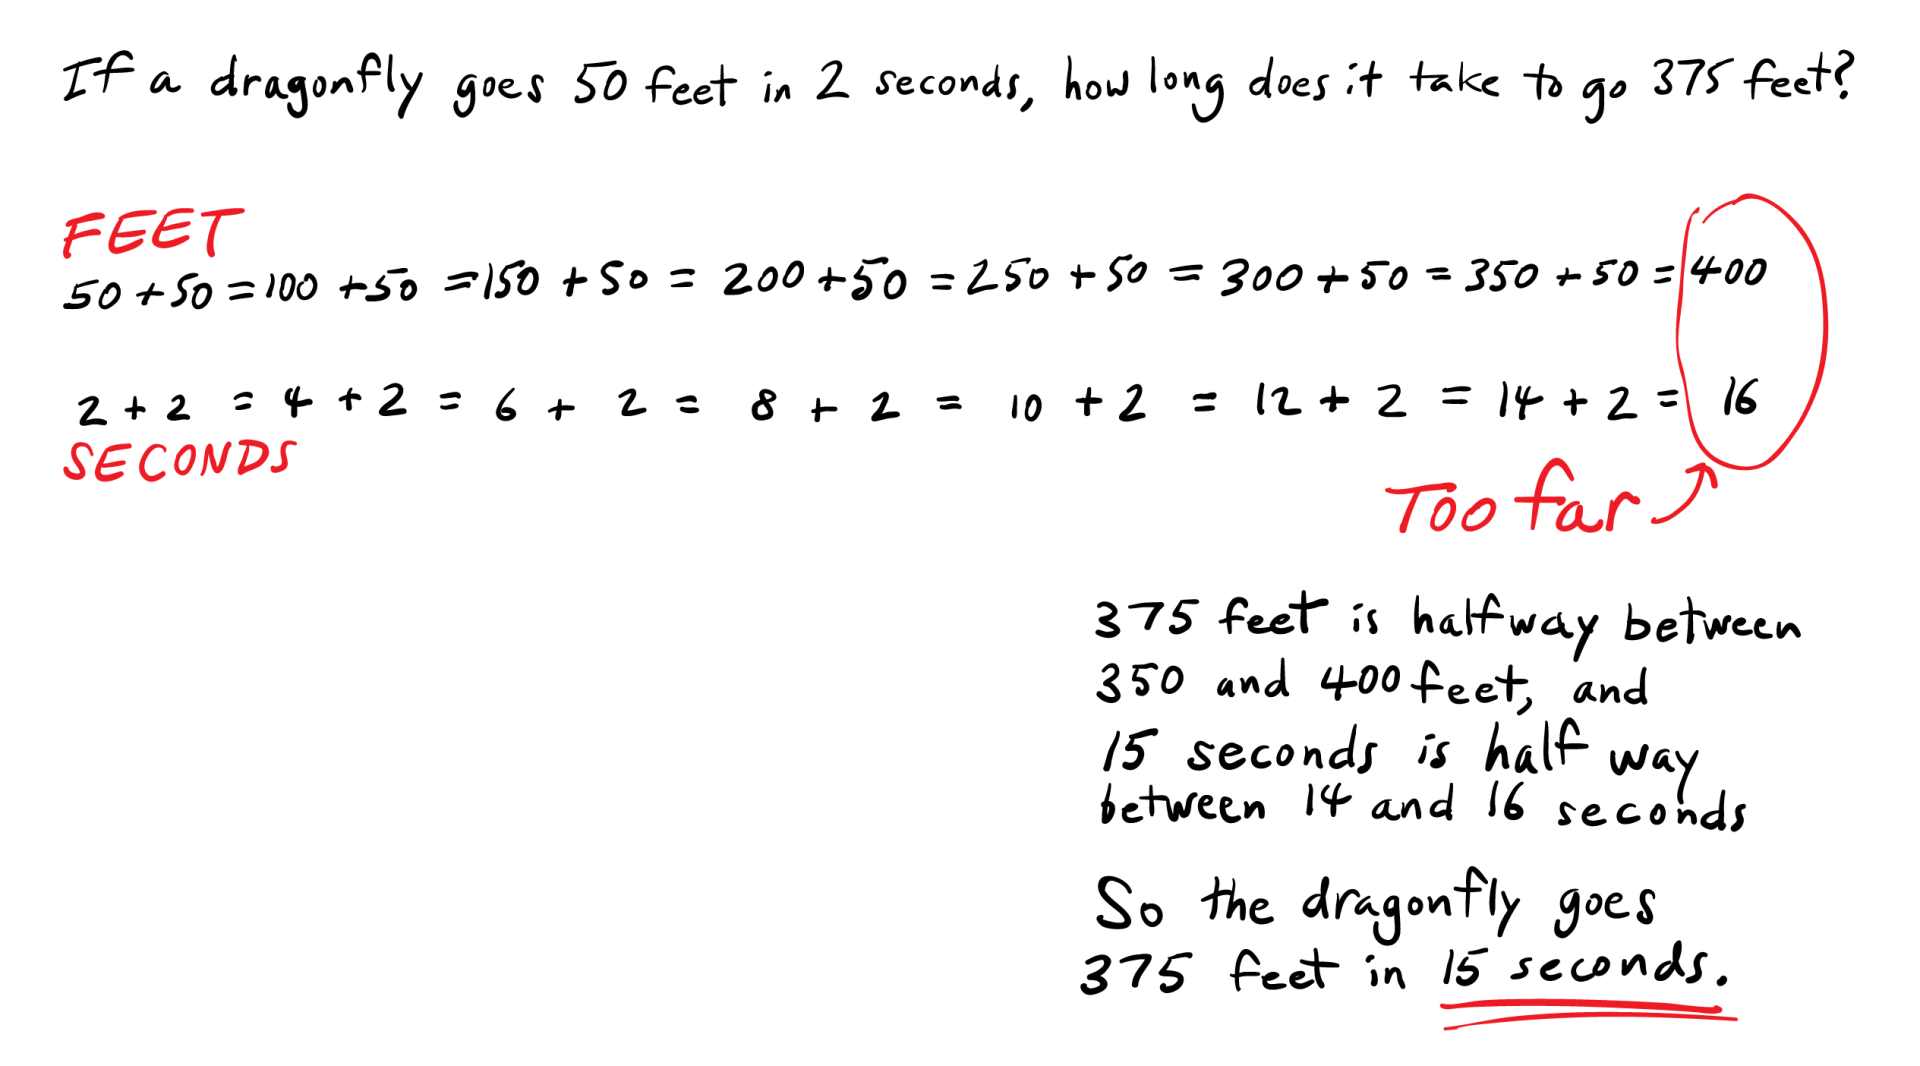
Level 1: Adding and Skip-Counting.
Most 6th grade students will use additive ways of thinking to get answers to rate problems. Such methods work fine to make sense of the quantitative situation and get the answer, if the numbers are convenient enough to permit a reasonable number of calculations.
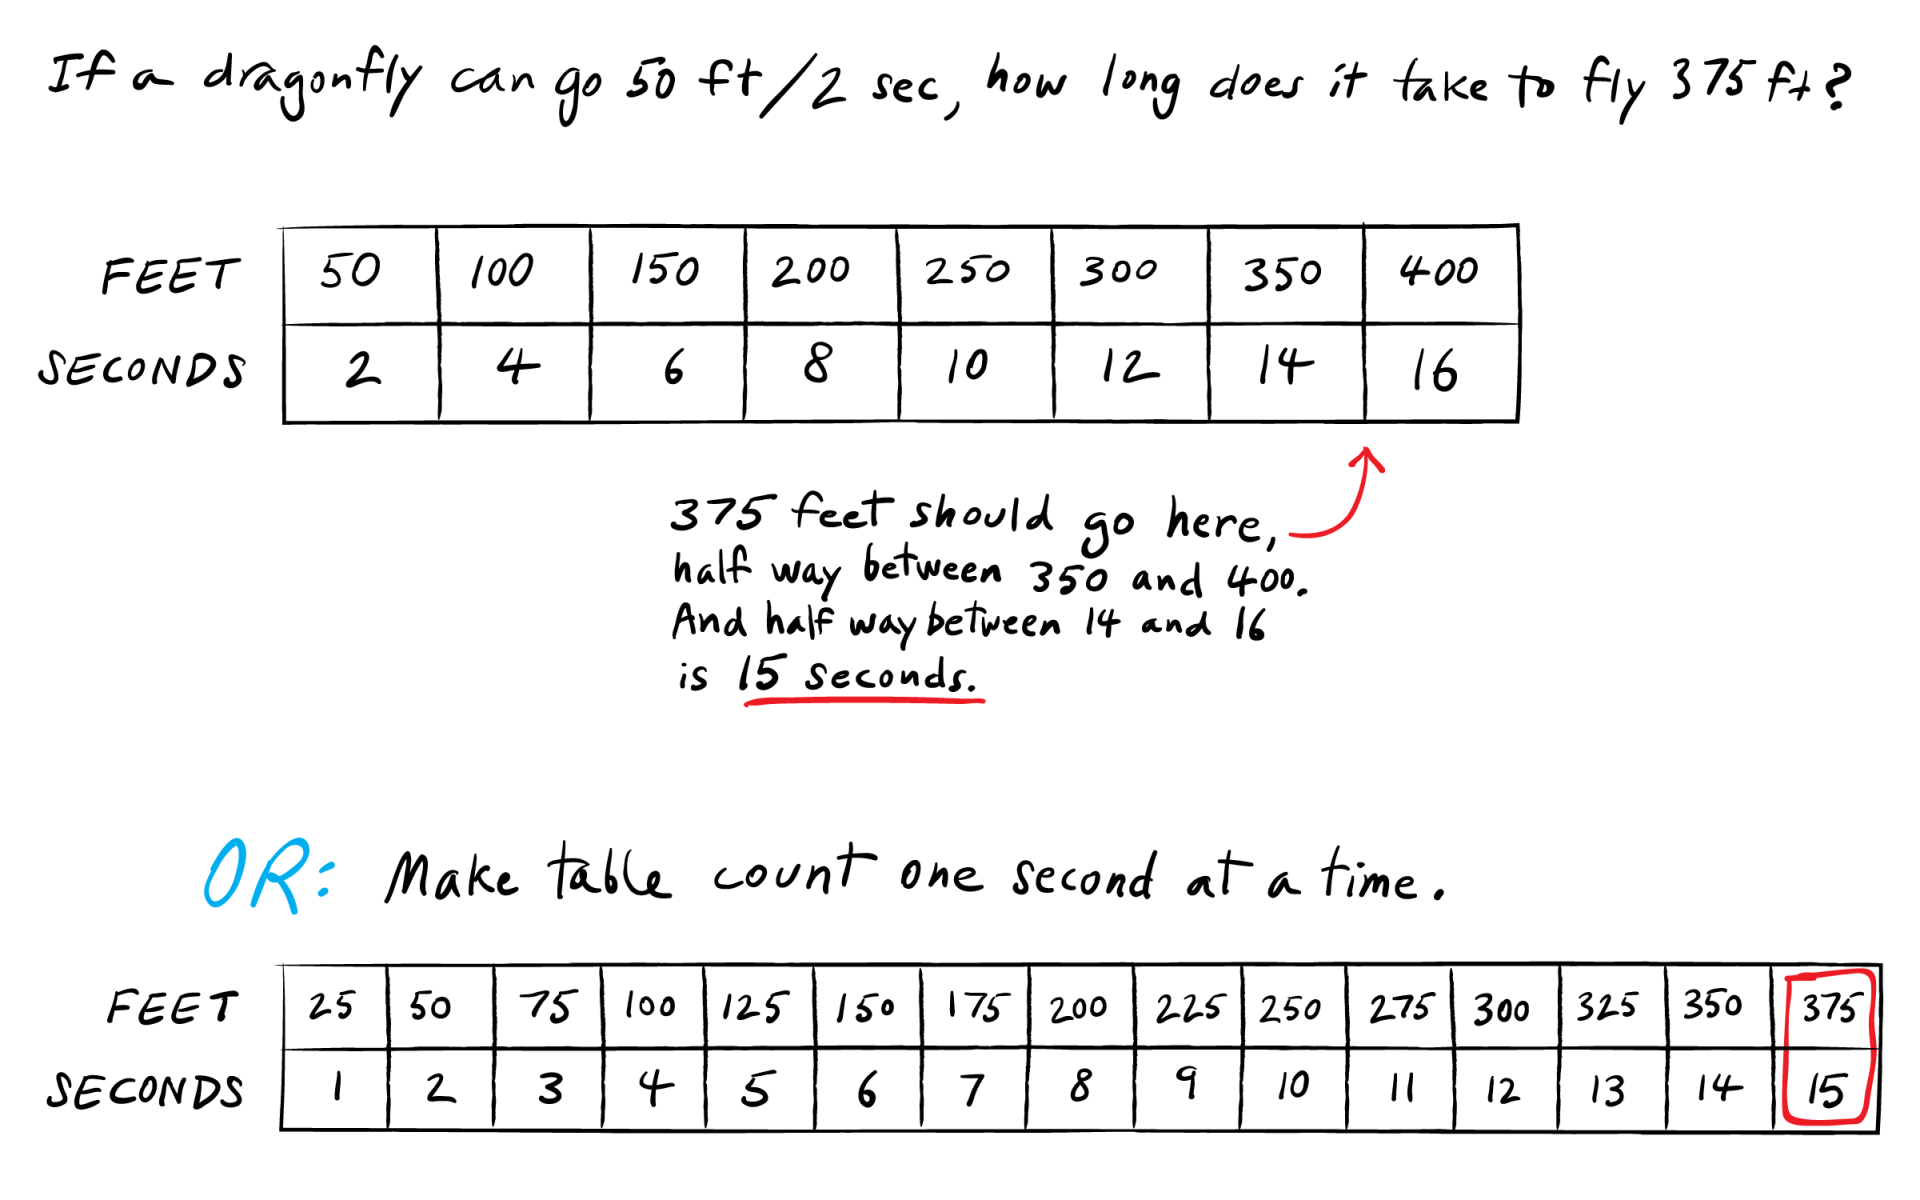
Level 2: Tables. Some students will be more organized and use tables. A table is a basic tool from 4th grade through college mathematics. You will want to encourage their use. If some students are not sure how to use tables, now is a good time to learn. Many students can read tables by 6th grade but do not know how to use them for making sense of situations.
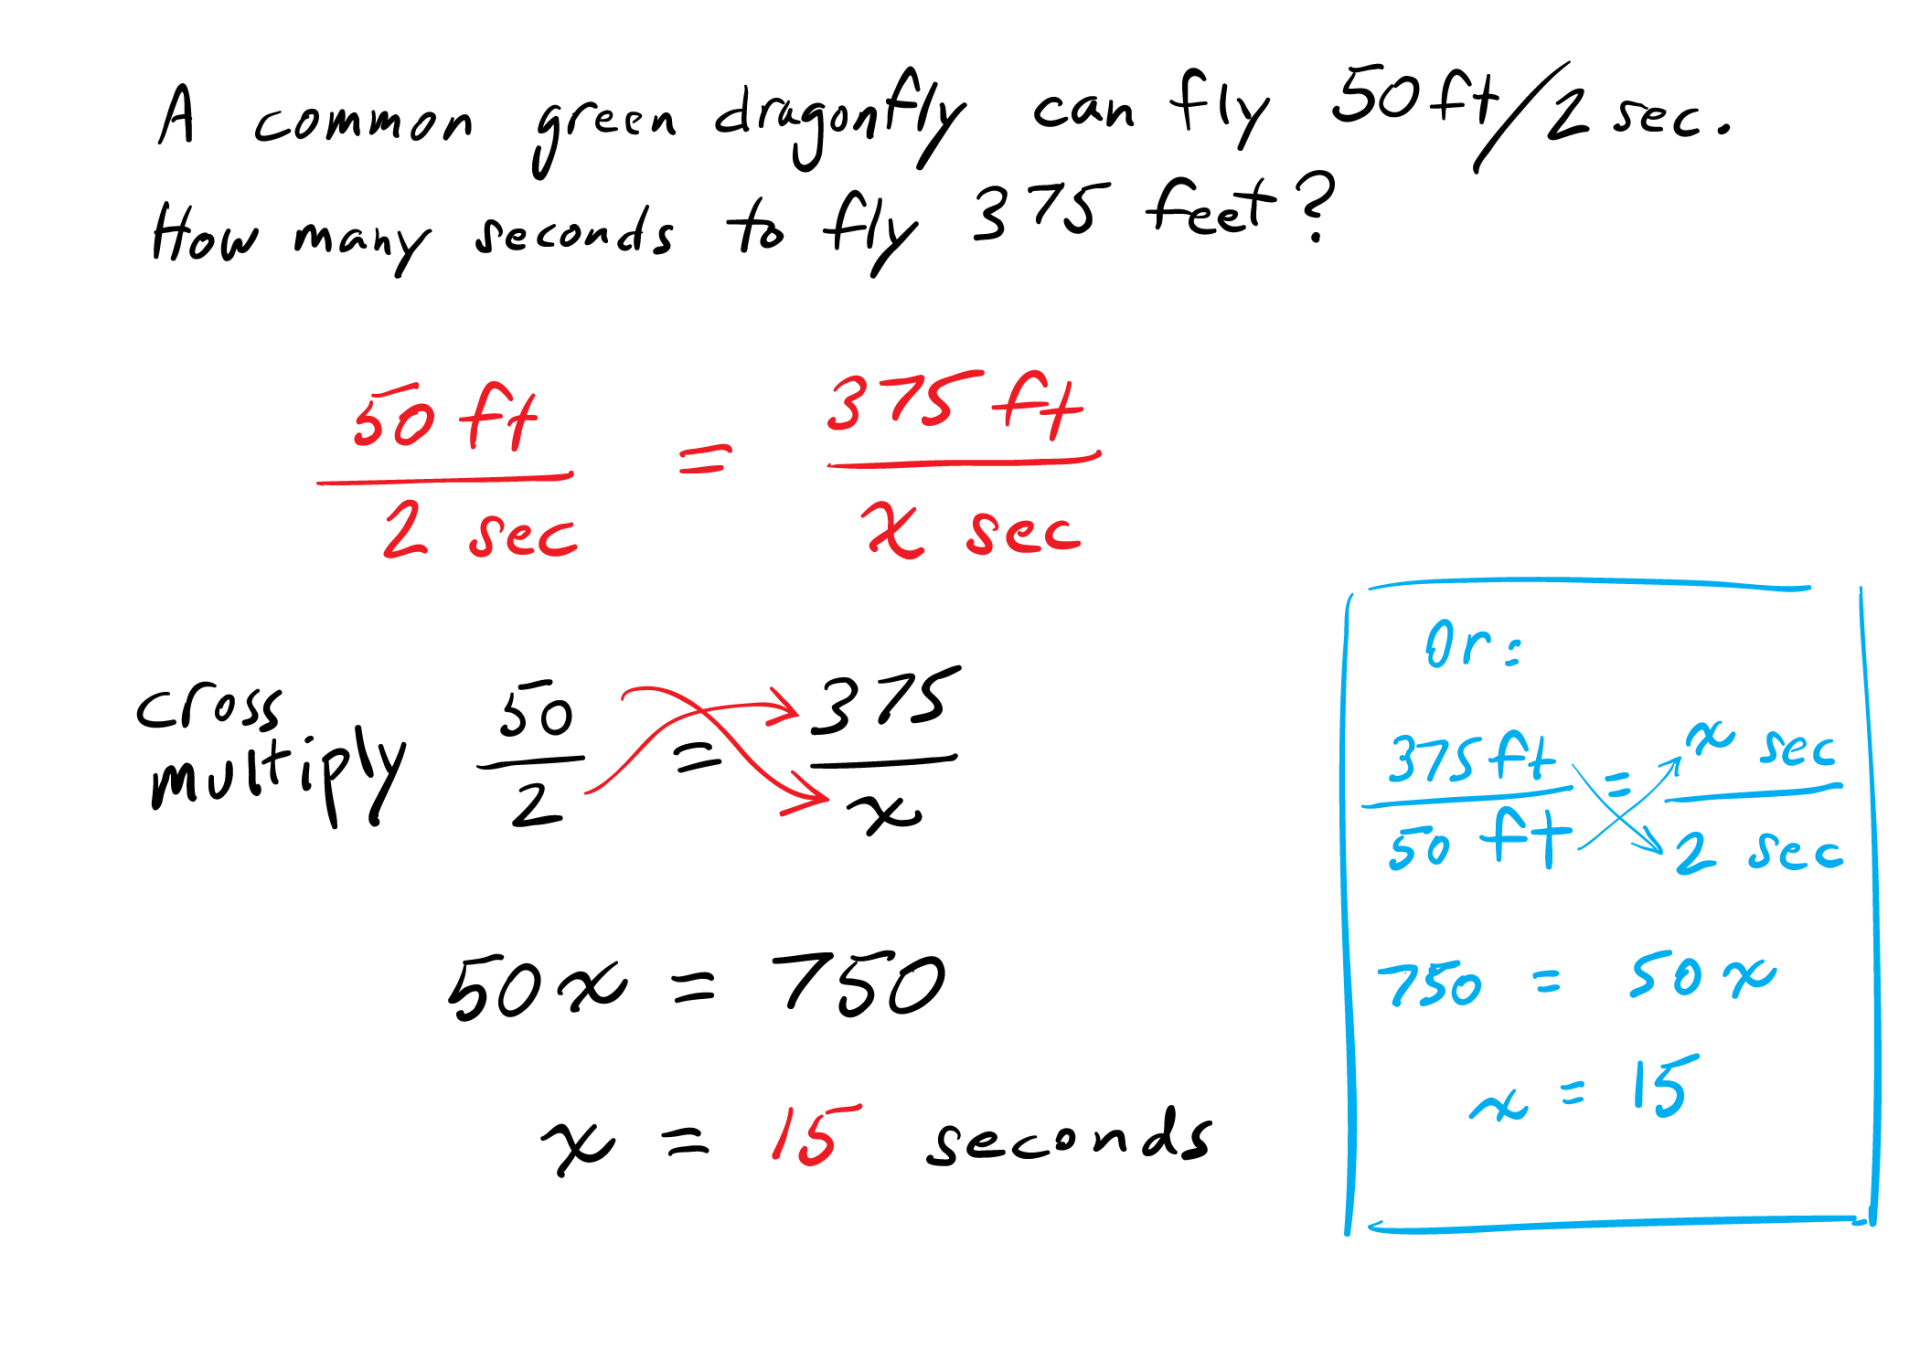
Level 3: Multiplying. A good strategy, but watch out. Some students rush to calculating answers, and miss the chance to learn mathematics. In this problem, the important mathematics is in the relationship: how two quantities, distance and time, vary proportionally. Co-variation is a basic building block for understanding variables and functions.
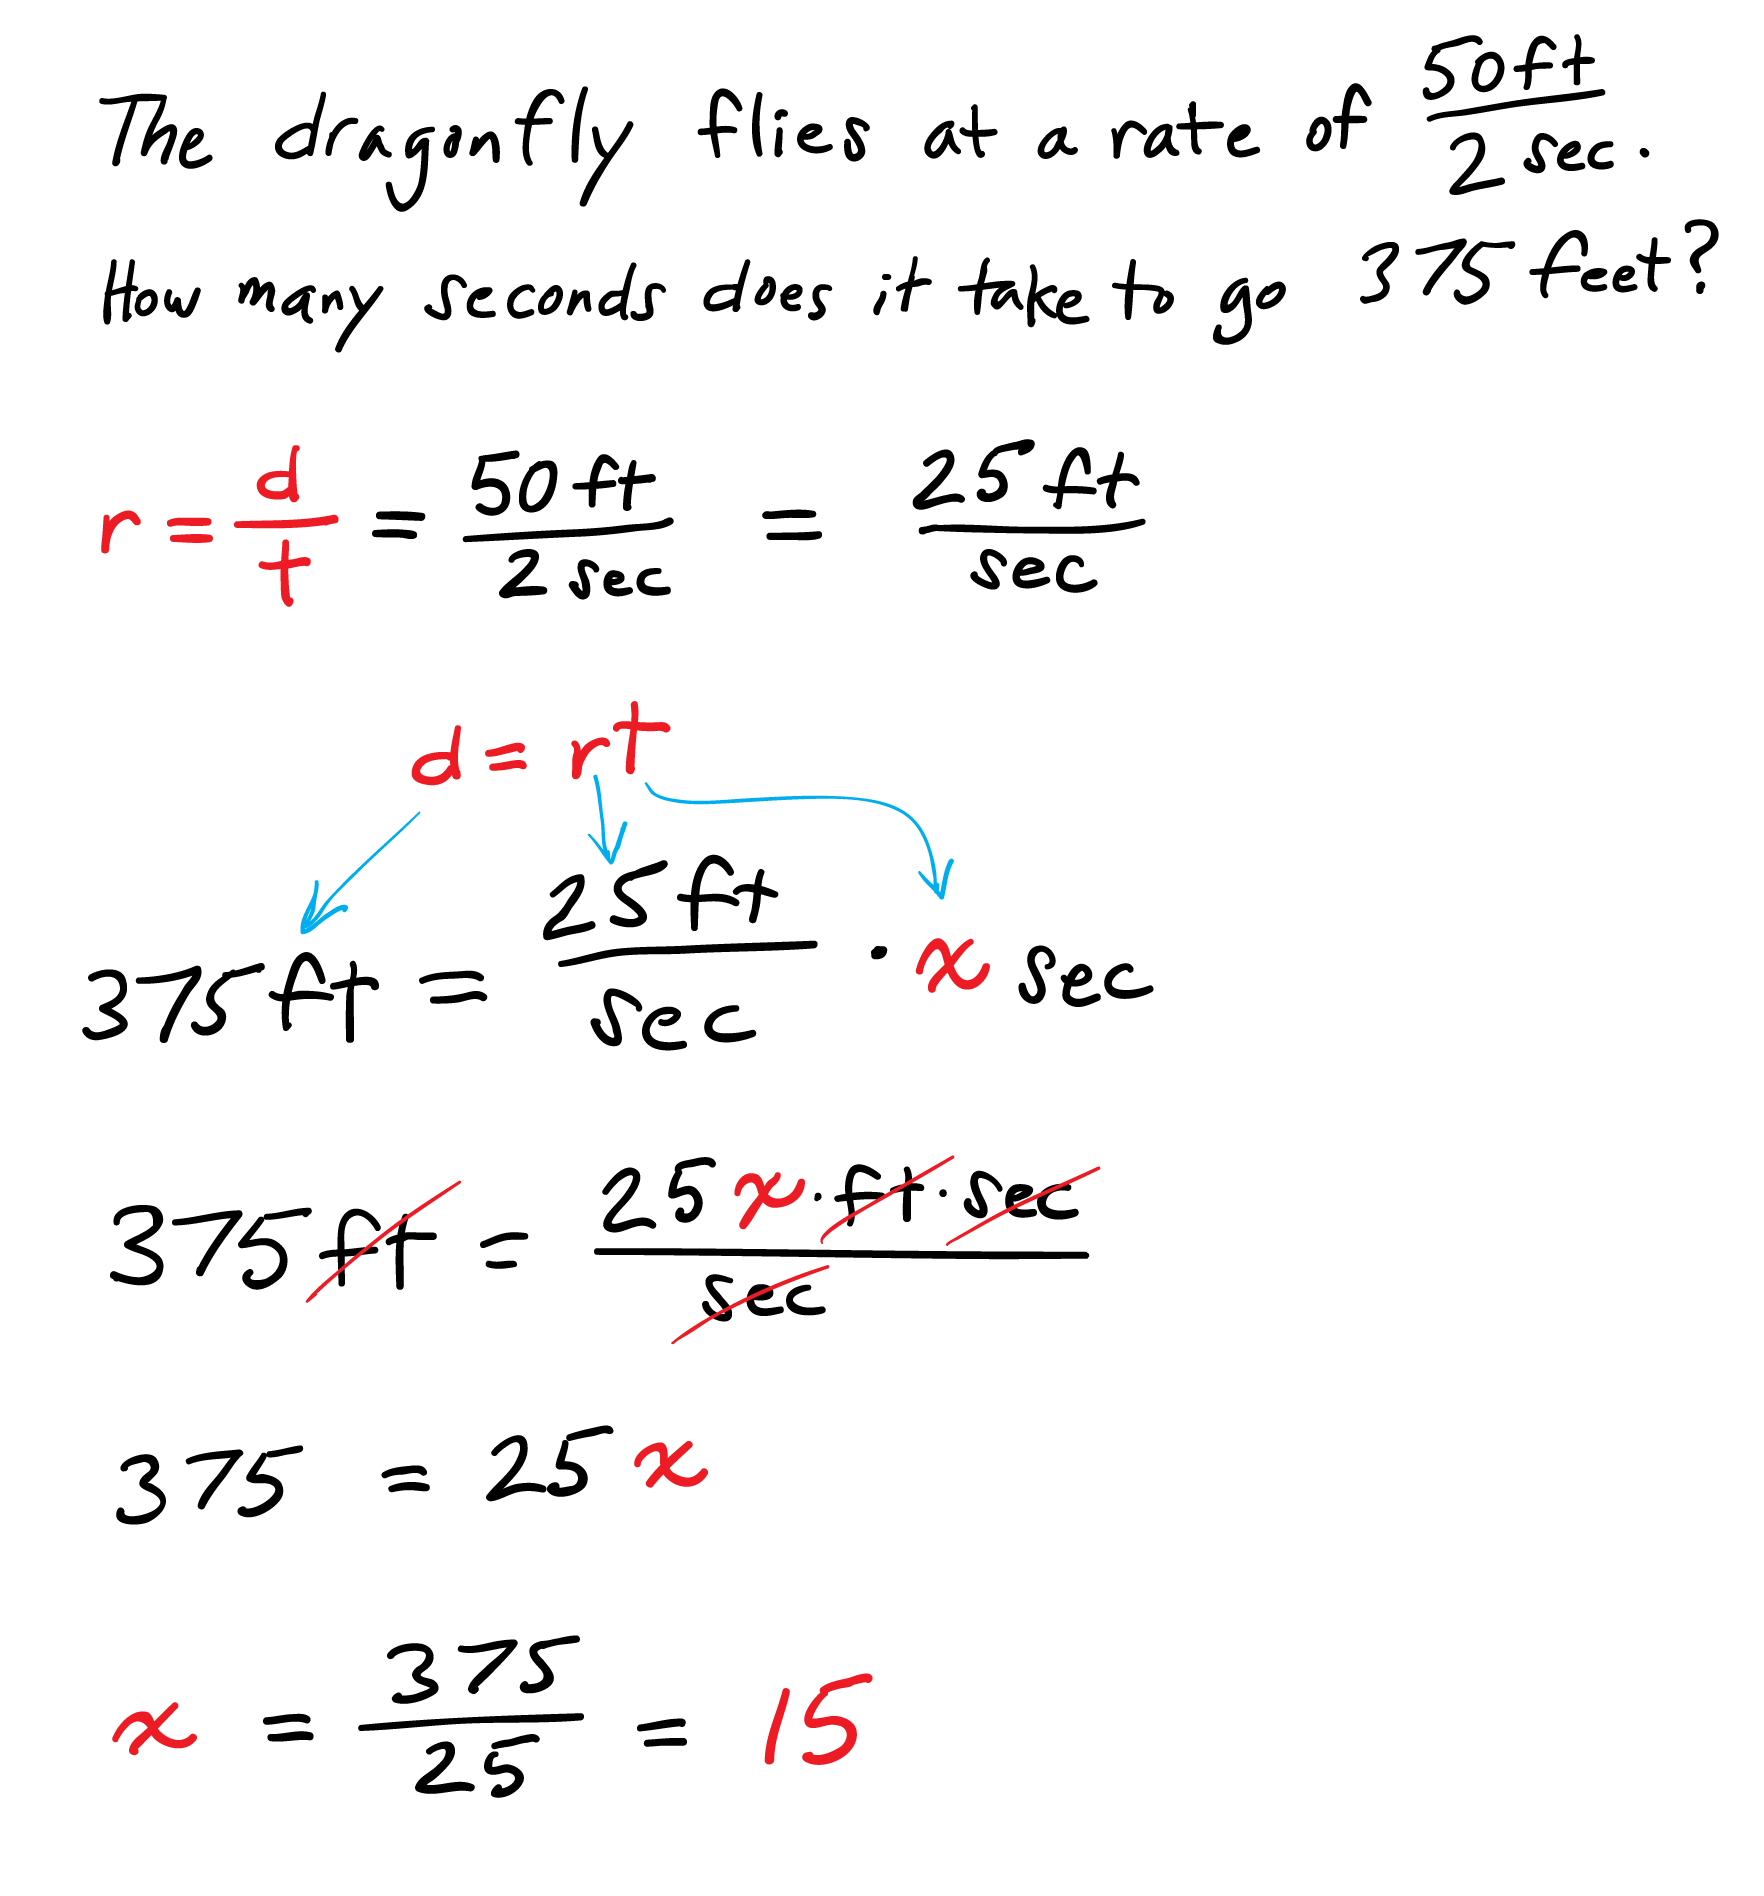
Level 4: Equations. The equation d = rt expresses that distance equals (speed) times (time). Speed is a rate. In this case, 25 feet/second is the speed, so d = 25t. Some students who use the equation might use 50/2 as the rate, which is equivalent. All students should learn how to get this equation from 50/2 = 375/x or from 375/50 = x/2. All should also understand how the equation generates the values in the tables.
Level 5: Number Lines and Graphs. Thinking about distance traveled as a function of time traveled demonstrates an understanding of functions and variables. Call on students who think this way to help all students see how to think in terms of variables. Some students might use number lines, double number lines, or graphs to help them. Consider these questions about graphs and their connections to other strategies.
- Why is the graph a straight line?
- Why does it go through (0, 0)?
- Where can you find the pairs of values in the tables on the graph?
- Where is “50 feet in 2 seconds” on the graph?
- Where is the unit rate?
- Where is the equivalence of 25/1 = 50/2 = 100/4 = 375/15 ?
- How does the graph correspond to the equation d = rt?
This group of questions is worth a whole lesson. It develops many standards in grade 6 and builds the foundation for 7 and 8.
During discussion, also press for deeper understanding of unit rate.
Ask where the unit rate is in each way of thinking. Notice how unit rate is hidden in the skip counting because it isn't necessary for getting an answer. It shows up in the table in the 1, 25 row. The unit rate is the grade level mathematics students have to learn, so skip counters need to see and understand it in the tables and the equations. And the equation solvers need to see how it relates to tables and skip counting.
6. FOCUS PROBLEM: Same Concept in a New Context
Distribute Handout #2
and Handout #3.
Handout #2 Answer Key
Handout #3 Answer Key
The handouts describe two more problems in the same form as the dragonfly problem. You can choose various ways to present these handouts, for example as another group task, or as a homework assignment for individual students.
Ask students to use their ways of thinking to solve the Frog and Printer problems. Have them solve each using two different ways of thinking. Press for Levels 4 and 5 of mathematical thinking from your discussion of the student posters.
Project funding provided by The William and Flora Hewlett Foundation and S.D. Bechtel Jr. Foundation.

This work is licensed under a Creative Commons Attribution-NonCommercial-ShareAlike 4.0 International License.