Using T-Tables to Study Patterns
Students often need to make tables for numbers, patterns, and other data. Many students are familiar with “T” tables, which have columns for numbers. The columns have titles, and each new row represents a new “case,” which might be the next member of a sequence or the next data point.
These tables are useful for helping kids organize their numbers, and also to further their conceptual understandings. It’s worth taking a moment to see how the tables work, and what they require.
Tables to help with developing expressions
The tune-up “Generating Equations from Patterns” describes the problem in general: how do students learn to write symbolic expressions that capture a quantitative relationship?
One strategy is to use a data table effectively. And to do that, they need to be aware of at least three things that may not be obvious.
- You might need a column to represent an “index” number, something to tell you where you are in the pattern. Let’s use an example. Suppose we’re looking at a number pattern: {5, 9, 13, 17, …}. What’s the 50th number in the pattern? If you simply make the table below on the left, you’ve only changed the list from horizontal to vertical. There’s no way to connect the numbers in the pattern to the “50.”
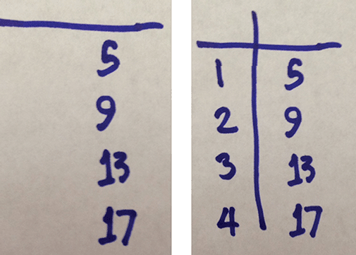
On the other hand, if you make the table above right, you can look for the relationship between the two columns. Once you discover the relationship (multiply the left column by 4, then add one) you can use it to answer the question.
This new column is an “index” into the number pattern. It’s a convenience: the first number is opposite the 1, the second is opposite the 2, and so forth. We often call it n, which means that it’s best if you don’t use the same letter for the column with the number pattern in it!
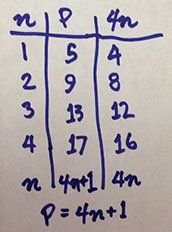
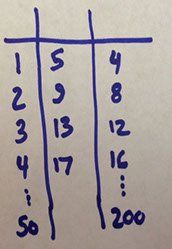
- Second, you can always make new columns. New columns can help if you can’t quite see the pattern, or if you aren’t sure how to express it. Here, we have an idea that the pattern has something to do with 4, so we make a column that’s 4 times the index. Now the relationship is easy to see, and we can answer the original question: the 50th number will be 201.
- Finally, if you name your columns well, you can use your labels as variable names. You can also use expressions as column titles, and you can make a “generalization row” with symbols instead of numbers.